Logger Shield
Start the logs!
Overview
Design
Make it!
Use it!
RTC usage
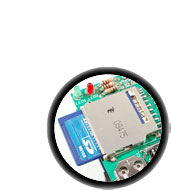
SD card
Light/Temp Logger
Walkthru
Download
Buy Kit
Forums
Home
About
ladyada.net
Portfolio
Research
Press
Publication & Presentation
Photos
Wiki (backend)
Projects
Arduino »
Datalogger Shield
Ethernet Shield
GPS Shield
Proto Shield
Motor Shield
Wave Shield
Adj. power supply
Brain Machine
BoArduino
DIGG Button
Drawdio
Fuzebox
Game Grrl
Game of Life
Ice Tube clock
MIDIsense
MiniPOV2
MiniPOV3
MintyMP3
MintyBoost
MONOCHRON
SIM Reader
SpokePOV
TV-B-Gone
Tweet-a-Watt
USBtinyISP
Wave Bubble
x0xb0x
XBee
YBox2
Quickies »
USB Gamepad
Halloween Pumpkin
Vintage Bike Lite
Kite Arial Photo
Bike Stand
LiIon Bike Lite
Pogo Jib
Mass Programming
Solar LiPo Charging
Magstripe Reader
Solar Tracker
TRON Bag
More...
->Instructables
Learn
Arduino tutorial
AVR tutorial
Barcode scanners
EL Wire tutorial
LCDs
LEDs
Multimeter tutorial
Digital scales
Sensors »
FSR
CdS Photocell
Temperature
Tilt
PIR
Thermocouple
IR Receiver
Breakout boards »
DS1307 RTC
MAX6675
ATmega32u4 Breakout+
Products »
i2c/SPI LCD backpack
USB Boarduino
ATmega32u4 Breakout+
2.8 TFT touchscreen
1.8 SPI TFT
RFID/NFC
Chumby Hacker Board
Soldering tutorial
Power Supply tutorial
Brother KH-9033 tutorial
USB reverse-engineering tutorial
Calipers tutorial
RGB LED Strips
RGB LED Pixels
LiIon & LiPoly Batteries
Library
Arduino Hacks
Batteries
Boost Calc
E.E. Tools
E.E. Computer
Find Parts
Kits
Laser
uC Annoyances
Open Source Hardware
PCB Design & Tips
PIC vs. AVR
Software
SMT
Zen-Cart Mods
Blog
Store
Forums
ladyada.net
Moved!
This tutorial
has moved to http://learn.adafruit.com/adafruit-data-logger-shield
April 12, 2013 11:30